
Study reveals the healthiest places to live in the UK, with Milton Keynes in seventh place.
-
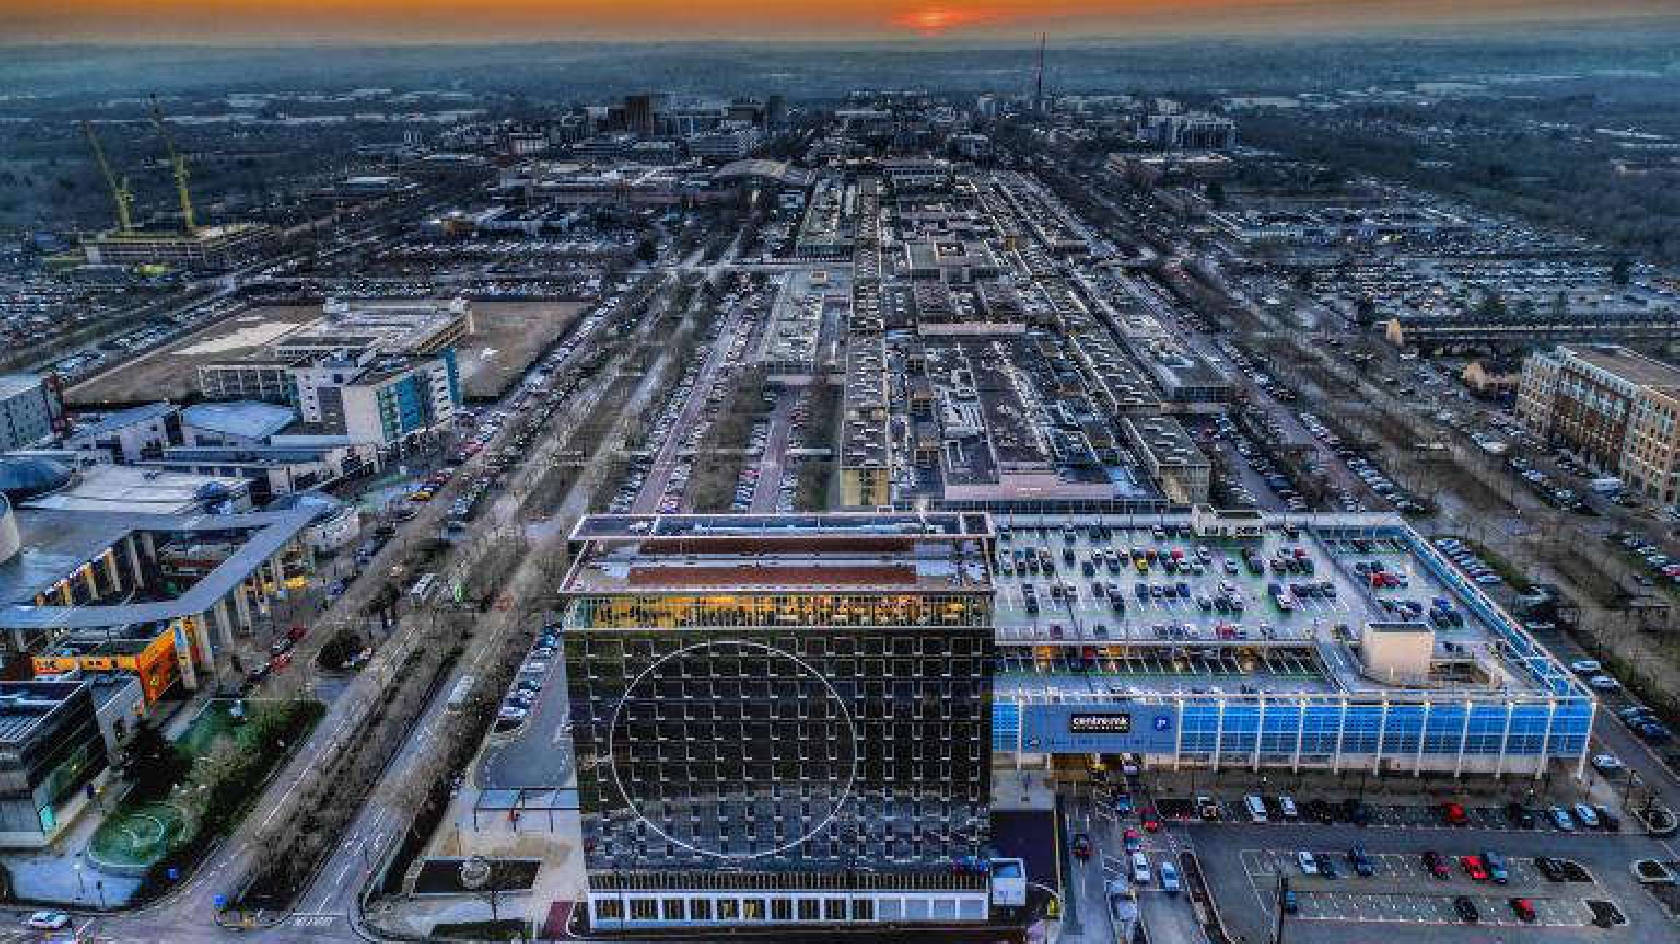
Milton Keynes ranked seventh on the list of the UK’s healthiest cities.
-
STATS: Milton Keynes has the highest no. of green spaces per 100K people.
-
Durham tops the list with strong healthcare, low patient-to-GP ratio, and ample green space, despite not excelling in sports facilities or healthy restaurants.
-
London ranks second, leading in fitness and healthy dining options but struggling with poor air quality, low pharmacy availability, and high patient numbers per GP.
-
Burnley takes third place with solid healthcare and a high number of pharmacies, though its sports facilities and air quality are mid-range.
-
York ranks fourth, offering the best GP access and a low smoking rate but scoring lower in healthy dining and health events.
-
Coventry ranks last. Despite decent GP access and green space, it struggles with high pollution, fewer pharmacies, and a higher smoking rate than most cities.
Health and well-being are influenced by a variety of factors, including access to medical services, air quality, and the availability of green spaces. Living in a city that prioritises these factors can make it much easier to maintain an active lifestyle, breathe cleaner air, and get the healthcare you need when you need it.
While no city can promise perfect health, choosing one with a strong commitment to well-being can certainly make a big difference.
The research, conducted by UK Vein Clinic, analysed 55 major UK cities based on nine key factors, such as healthcare strength, GP availability, air quality, green spaces, and smoking rates. The results reveal which cities stand out as the healthiest places to live in the UK.
Milton Keynes follows in seventh place with a 39.00 score, leading in parks per 100,000 people (168.64), the most of any ranked city. However, its 138 air quality score is the worst in the top 10. The city has 2,093 patients per GP, placing it in the middle of the list for healthcare access.
Full list of the healthiest cities in the UK:
|
Rank |
Cities |
Health Care System Index |
Number of Patients per One GP |
Air Quality |
Green Spaces (per 100,000 residents) |
Sport Facilities (per 10,000 residents) |
Healthy Restaurants (per 100,000 residents) |
Health Events (per 100,000 residents) |
Registered Pharmacies (per 100,000 residents) |
Cigarette Smokers (%) |
Total Score |
|
1 |
Durham |
92.6 |
1,698 |
45 |
102.6 |
18.7 |
6.4 |
2454.7 |
298.9 |
15.4 |
52.90 |
|
2 |
London |
69.6 |
7,793 |
137 |
89.14 |
111.9 |
521.0 |
42.2 |
4.6 |
15.8 |
51.75 |
|
3 |
Burnley |
82.8 |
2,150 |
64 |
99.55 |
11.6 |
11.3 |
3551.8 |
38.3 |
15.4 |
43.35 |
|
4 |
York |
82.4 |
1,429 |
82 |
81.73 |
21.4 |
2.0 |
1792.9 |
282.3 |
8.7 |
42.84 |
|
5 |
Chelmsford |
83.1 |
2,100 |
131 |
113.88 |
19.8 |
6.1 |
3816.3 |
21.8 |
14.5 |
39.79 |
|
6 |
Chester |
64.6 |
1,900 |
115 |
105.46 |
19.7 |
12.8 |
3178.4 |
450.8 |
8.9 |
39.22 |
|
7 |
Milton Keynes |
74.2 |
2,093 |
138 |
168.64 |
17.7 |
7.3 |
3040.2 |
21.8 |
13.8 |
39.00 |
|
8 |
Gloucester |
87.5 |
2,050 |
118 |
72.6 |
16.8 |
1.3 |
3526.2 |
103.8 |
18.1 |
38.37 |
|
9 |
Preston |
78.9 |
2,100 |
63 |
69.05 |
13 |
5.9 |
2687.6 |
101.6 |
16.3 |
37.78 |
|
10 |
Poole |
87.0 |
2,150 |
105 |
54.94 |
14.2 |
3.8 |
2553.6 |
22.7 |
10.1 |
37.57 |
|
11 |
Bath |
75.5 |
1,646 |
118 |
110.6 |
24.7 |
0.0 |
3060.8 |
64.8 |
11.5 |
36.68 |
|
12 |
Exeter |
78.6 |
3,889 |
102 |
75.88 |
16.9 |
5.6 |
951.2 |
22.2 |
15.3 |
35.61 |
|
13 |
Dundee |
88.7 |
1,800 |
53 |
? |
17.3 |
6.6 |
403.5 |
24.2 |
15.8 |
34.84 |
|
14 |
Ashford |
67.1 |
2,200 |
126 |
110.64 |
20.5 |
4.9 |
5160.4 |
21.9 |
13.6 |
34.28 |
|
15 |
Newcastle upon Tyne |
77.9 |
1,900 |
46 |
54.49 |
14.4 |
25.6 |
363.0 |
27.9 |
12.1 |
33.98 |
|
16 |
Cambridge |
71.6 |
2,000 |
113 |
82.69 |
23.2 |
19.1 |
3313.1 |
101.5 |
13.8 |
33.50 |
|
17 |
Oxford |
72.4 |
1,481 |
125 |
81.73 |
22.1 |
7.3 |
3571.5 |
77.3 |
7.4 |
33.49 |
|
18 |
Plymouth |
75.5 |
2,000 |
56 |
80.38 |
14 |
7.0 |
217.2 |
19.1 |
14.7 |
33.06 |
|
19 |
Colchester |
74.0 |
2,000 |
142 |
84.26 |
20.7 |
15.2 |
3378.2 |
32.2 |
12.1 |
31.49 |
|
20 |
Ipswich |
72.9 |
1,995 |
111 |
83.23 |
15.4 |
2.9 |
2560.0 |
29.0 |
13.7 |
31.14 |
|
21 |
Aberdeen |
76.1 |
1,400 |
34 |
? |
17.3 |
25.7 |
158.8 |
44.4 |
11.5 |
30.95 |
|
22 |
Wolverhampton |
85.0 |
2,150 |
124 |
44.78 |
14 |
0.1 |
1658.0 |
29.1 |
15.1 |
30.64 |
|
23 |
Leeds |
79.1 |
1,656 |
97 |
51.84 |
17 |
53.6 |
540.7 |
29.3 |
12.4 |
30.00 |
|
24 |
Edinburgh |
75.8 |
1,850 |
70 |
? |
17.3 |
68.0 |
121.7 |
19.5 |
8.3 |
29.93 |
|
25 |
Stoke-on-Trent |
81.1 |
2,150 |
116 |
58.14 |
13.9 |
0.4 |
1235.6 |
34.5 |
16.3 |
29.78 |
|
26 |
Stockport |
64.6 |
2,200 |
105 |
84.46 |
16.5 |
3.3 |
2594.5 |
57.7 |
11.8 |
29.33 |
|
27 |
Portsmouth |
75.6 |
2,462 |
118 |
60.39 |
13.5 |
1.6 |
2140.5 |
17.0 |
14.7 |
29.30 |
|
28 |
Southampton |
78.1 |
2,050 |
122 |
55.84 |
10.5 |
8.9 |
1971.1 |
30.4 |
13.2 |
29.20 |
|
29 |
Bolton |
75.7 |
2,000 |
100 |
50.93 |
14.4 |
11.5 |
1608.1 |
51.1 |
14.2 |
29.16 |
|
30 |
Norwich |
77.9 |
2,000 |
126 |
79.68 |
12.8 |
4.7 |
538.0 |
33.4 |
13.5 |
28.98 |
|
31 |
Peterborough |
66.1 |
2,100 |
138 |
106.15 |
15.4 |
1.3 |
2728.5 |
26.8 |
12.2 |
28.48 |
|
32 |
Warrington |
60.6 |
1,570 |
96 |
99.82 |
19.9 |
2.7 |
1680.4 |
33.2 |
9.9 |
27.30 |
|
33 |
Reading |
74.3 |
2,100 |
135 |
56.12 |
14.2 |
2.4 |
2845.8 |
29.9 |
14.4 |
27.30 |
|
34 |
Sheffield |
79.4 |
1,575 |
119 |
47.27 |
13.1 |
26.9 |
631.3 |
29.6 |
12.0 |
27.09 |
|
35 |
Sunderland |
64.9 |
1,876 |
40 |
49.1 |
15.2 |
4.9 |
546.7 |
30.9 |
13.2 |
26.89 |
|
36 |
Leicester |
71.2 |
2,150 |
126 |
67.41 |
11 |
17.1 |
1446.2 |
59.8 |
12.8 |
26.77 |
|
37 |
Glasgow |
78.9 |
2,000 |
102 |
? |
17.3 |
126.7 |
34.0 |
15.2 |
17.8 |
26.25 |
|
38 |
Swindon |
61.4 |
1,646 |
122 |
87.66 |
16.2 |
6.1 |
3093.0 |
26.1 |
9.5 |
26.23 |
|
39 |
Blackpool |
71.3 |
1,834 |
74 |
44.15 |
13.5 |
14.3 |
1476.0 |
32.2 |
18.8 |
25.94 |
|
40 |
Belfast |
71.7 |
2,100 |
53 |
? |
17.3 |
20.5 |
74.1 |
? |
18.7 |
25.08 |
|
41 |
Liverpool |
79.1 |
1,354 |
103 |
35.14 |
10.5 |
31.6 |
548.8 |
39.7 |
17.3 |
24.62 |
|
42 |
Manchester |
74.4 |
2,150 |
102 |
34.14 |
10.3 |
20.4 |
646.2 |
72.9 |
17.3 |
24.61 |
|
43 |
Derby |
75.7 |
1,530 |
121 |
54.04 |
12.1 |
11.0 |
1306.2 |
78.0 |
19.3 |
24.50 |
|
44 |
Middlesbrough |
62.5 |
2,100 |
44 |
39.31 |
13.6 |
3.3 |
1214.4 |
31.0 |
16.5 |
24.50 |
|
45 |
Harlow |
58.3 |
2,200 |
148 |
73.93 |
14.5 |
3.2 |
5386.6 |
19.2 |
14.6 |
23.47 |
|
46 |
Bristol |
72.4 |
1,680 |
112 |
45.34 |
11.4 |
45.8 |
583.2 |
36.7 |
14.8 |
23.37 |
|
47 |
Swansea |
63.2 |
2,000 |
101 |
69.71 |
17.3 |
11.2 |
421.6 |
28.0 |
12.0 |
23.36 |
|
48 |
Wigan |
63.5 |
2,150 |
96 |
63.98 |
15.6 |
1.1 |
868.4 |
15.2 |
14.7 |
22.88 |
|
49 |
Cardiff |
67.5 |
1,950 |
109 |
51.89 |
17.3 |
45.7 |
374.2 |
17.7 |
13.7 |
22.58 |
|
50 |
Luton |
71.1 |
2,093 |
119 |
38.52 |
12 |
4.7 |
2475.4 |
18.4 |
21.1 |
21.96 |
|
51 |
Birmingham |
72.0 |
1,887 |
132 |
32.16 |
10.1 |
88.2 |
367.4 |
26.7 |
13.6 |
20.94 |
|
52 |
Nottingham |
68.3 |
2,100 |
127 |
52.54 |
13 |
32.5 |
1194.1 |
81.1 |
21.2 |
20.89 |
|
53 |
Basildon |
59.3 |
2,300 |
189 |
93.42 |
12.7 |
10.3 |
4018.5 |
23.3 |
19.4 |
18.70 |
|
54 |
Southend-on-Sea |
60.3 |
1,908 |
143 |
30.17 |
14 |
18.8 |
2490.6 |
10.4 |
14.0 |
15.75 |
|
55 |
Coventry |
53.8 |
1,722 |
121 |
31.61 |
15.1 |
15.9 |
1806.4 |
33.1 |
18.4 |
11.96 |
Methodology
This study analyzed 55 major UK cities to determine the healthiest cities by considering 8 key factors. These factors were assigned weights based on their impact on overall health, and data was collected for all cities. Scores for each factor were scaled from 0 to 100, where 100 represents the best performance.
Here are the factors, along with their respective weights:
-
Health Care System Index (20%) - Note: This metric includes various aspects such as the availability of medical staff, quality of medical services, and general healthcare satisfaction across cities. This shows how well a city's healthcare system supports the residents' needs.
-
Number of Patients per One GP (15%) - Note: This shows the ratio of patients to family doctors in each city. Fewer patients per GP typically indicate better access to healthcare.
-
Air Quality (14%) - Note: This reflects the current air quality levels in each city. Air quality is a key indicator of environmental health.
-
Green Spaces per 100,000 residents (14%) - Note: This reflects the number of parks and play areas per 100,000 people in each city, showing how accessible green spaces are for residents.
Sport Facilities per 10,000 residents (8%) - Note: This shows the availability of sport facilities per 10,000 people, which plays a big role in encouraging active lifestyles. -
Healthy Restaurants per 100,000 residents (8%) - Note: This counts healthy restaurants per 100,000 people, reflecting the availability of nutritious food options.
-
Health Events per 100,000 residents (8%) - Note: This reflects the number of health-related events per 100,000 people. These events can range from wellness gatherings to informational health sessions, depending on availability in each city.
-
Registered Pharmacies per 100,000 residents (8%) - Note: This shows how many pharmacies are available per 100,000 people in each city, indicating access to medications and health services.
-
Cigarette Smokers (%) (5%) - Note: This shows the percentage of people who smoke in each city. A lower percentage of smokers reflects better overall health.